


The Origins of the Binary Decisioning Model
Sixteen years ago, while working alongside Jamon Whitehead and the late Greg Davis, we stumbled onto an idea while solving for business fraud. At the time, the mission wasn’t cybersecurity at all; it was preventing criminals from abusing business logic and stolen payment methods to obtain goods. But in doing so, we realized something important: we were already using security telemetry to collect the information needed for fraud analytics.
And then came the bigger revelation. The same bot networks leased to perpetrate fraud, testing stolen credit cards or brute forcing checkout systems, were also being rented out to launch distributed denial-of-service (DDoS) attacks. The line between fraud and cyber wasn’t just thin, it was practically nonexistent. What we thought of as separate problem sets were in fact powered by the same infrastructure.
At the time, the one problem forcing the hand toward binary models was that the gray space was simply too voluminous to solve by “throwing humans at it.” Retailers couldn’t physically review millions of transactions without breaking the very customer experience they were trying to preserve. While Zappos, Apple, and others faced different flavors of fraud, the scheme was similar, criminals monetizing stolen payment methods at scale, and the method to fight it required the same philosophy: work smarter, not harder.
Whether it’s a stolen credit card used to order sneakers from Zappos or stolen credentials leveraged to download a movie on Apple TV, fraud has one constant: it erodes trust, drives financial loss, and threatens customer experience.
Large retailers solved this dilemma by creating decisioning models that balance loss prevention with frictionless customer experience. They segment transactions into known good, known bad, and gray (uncertain), then continuously tune models to shrink the gray.
It worked for fraud prevention. So, why haven’t we done the same in cybersecurity?
Fraud Is Not an Apt Analogy
Fraud analytics is a useful starting point, but it isn’t a perfect fit for cybersecurity. In consumer fraud, if Apple gets it wrong, they might lose $30 on a movie rental. If Zappos misclassifies a transaction, they might lose $150 on a pair of sneakers. That’s painful at scale, but manageable as a cost of doing business.
In cybersecurity, the stakes are different. A single missed event isn’t just a few dollars lost, it could trigger multimillion-dollar damages, reputational fallout, regulatory penalties, or even operational shutdowns. Breach economics are not equivalent to retail fraud economics; they’re existential.
This is where many practitioners underestimate the opportunity. They say: “We already classify events into good, bad, and unknown. This is nothing new.” But that misses the heart of the problem. The gray bucket in fraud was too voluminous to solve by throwing humans at it, which is why retailers engineered smarter models. In cyber, the gray bucket is even bigger, yet we still try to solve it with people power, one alert at a time.
The difference is in risk tolerance. Call centers are comfortable accepting that some calls go unanswered or some customers churn. Fraud teams accept that some transactions will slip through. But in cyber, executives consistently demand zero tolerance for missed breaches. Ask any board member if they’d accept a non-zero chance of showing up in the headlines, and the answer is always no.
That zero-tolerance mindset drives analysts to the extreme: investigate everything, leave nothing unchecked. It’s the classic insurance paradox: we invest heavily to prevent the cost of breach Y, but also refuse to accept any chance of missing the one event that leads to Y. The result? Burnout, backlogs, and a never-ending treadmill of investigations. If you’re curious about burnout in the cybersecurity, this is why.
And it isn’t a new dilemma. In distributed computing, it’s called the “exactly-once delivery” problem: guaranteeing no message is ever lost, duplicated, or mis ordered. In practice, it’s one of computing’s hardest problems Exactly-Once Delivery. Cybersecurity analysts wrestle with the same impossible expectation: handle millions of unpredictable events, investigate every gray area, and never miss the one that matters.
The Statistical Challenge of the Gray
If fraud analytics taught us anything, it’s that the gray bucket is where the real battle happens. Retailers discovered long ago that you can’t just throw more people at the problem. The volume is too high, the pace too fast, and the customer expectations too unforgiving. They turned to statistical models and decisioning frameworks out of necessity.
Cybersecurity is no different, except our gray space is even messier. Event inflows are stochastic; random, but with patterns hidden in the noise. The severity of those events is unpredictable. And layered on top of this, analyst skill levels vary widely, which means the hardest cases inevitably funnel to the smallest group of most experienced staff. It’s a recipe for bottlenecks and burnout.
And here’s the nuance often missed, even the supposedly easy black and white categories aren’t always clear cut. Sure, there are obvious examples, a known malware hash is bad, a clean software update from a trusted source is good. But beyond those, “black” and “white” require something most organizations struggle with: a definition of what you’re willing to tolerate as bad. In other words, how much risk are you truly willing to accept?
That definition can’t be generic. It has to be customized to the tolerances of the entity you work for: the agency, the enterprise, the boardroom appetite for risk. Unfortunately, many CISOs struggle to articulate those tolerances clearly. And if CISOs can’t answer the question, how can we expect managers or analysts in the SOC to find clarity?
This is why gray becomes so much harder. To know what’s important, you first need to know what’s not important. And because those tolerances shift, the only way to create a baseline is through statistical analysis of the dataset itself. Probability and statistics give us the natural, almost organic, baseline for analysis: what’s normal, and what’s not?
Queueing theory, for example, models analyst workload and backlog formation. Halfin & Whitt’s heavy-traffic regime shows how even well-staffed teams can fall behind once event arrival rates exceed a certain threshold, critically important for managing response and incident response during busy times. Bayesian inference offers a way to continuously update the probability that an event is malicious as new context arrives. Hidden Markov Models (HMMs) can surface changes in adversary behavior that analysts might miss in raw event streams. Monte Carlo simulations allow us to pressure-test “what if” scenarios when the unexpected inevitably happens.
Generally speaking, there’s a reason roles in data science, informatics, and statistics require deep training and specialization. The math behind large-scale event analysis isn’t something you casually pick up on a Friday afternoon. And in the absence of wanting to geek out on queueing models or probability distributions, the common substitution is to lean on machine learning algorithms. This is where leaders have to be careful. Too often, vendors wave their hands and promise that “AI” or “ML” will make the gray bucket disappear. That’s the magic systems paradox: the more a vendor insists their system is magical, the less likely they are to explain how it actually works; and the more you understand it, the less magical it becomes.
Machine learning can absolutely play a role in binary decisioning, but you cannot abdicate responsibility to understand how it works. If your provider can’t clearly articulate how their models function, what data they train on, and where the statistical rigor comes from, you’re betting your breach risk on blind faith.
None of these methods are silver bullets. But they shift the perspective: the SOC is not a call center, it’s a statistical system. By applying rigor to black, white, and gray alike, teams can stop drowning in alerts and start building the clarity needed to make decisioning scalable.
From Theory to Practice (Alternative Framing)
Start simple. Every security event falls into one of three categories:
1. Black: Things You Know Are Bad
These are the crime scenes. If you see one of these events occur and it’s allowed, wrap the building in yellow tape and start your incident response. No debate. No hesitation.
Five clear examples of unmistakably bad events:
- An endpoint beaconing out to a confirmed C2 server (from open-source or vendor threat intelligence).
- Successful use of a credential from two countries within minutes (impossible travel).
- Execution of Mimikatz or other credential-dumping tools on a domain controller.
- A user account spawning rundll32 or powershell.exe to pull from a known malicious domain.
- Outbound RDP (3389/TCP) traffic leaving your environment to the public internet.
These are “allowed” events, meaning they weren’t blocked by prevention controls, so they require immediate escalation.
2. White: Things That Are Benign or Already Blocked
These are events you don’t need to over-rotate on. They’re either:
- Blocked by your controls (good job, the tech is doing what you bought it for).
- Allowed but benign and tracked only for situational awareness.
The only reason you watch these is to see if the pattern signals that an adversary is poking around, which should raise vigilance elsewhere.
Five examples of benign events you track but don’t act on directly:
- A firewall denying inbound scans on port 22 (SSH).
- Multiple failed login attempts blocked by account lockout policy.
- An IPS blocking a known exploit attempt on an unpatched service (already blocked).
- A web application firewall (WAF) denying SQL injection probes.
- A spam filter blocking inbound emails with malicious attachments.
You don’t need to “double-verify” these. The system worked. Let it work. Your job here is just awareness; noticing if someone is rattling doorknobs and escalating vigilance if it looks persistent.
3. Gray — The 10% That Requires Human Investigation
Now the hard part. For easy math, let’s assume:
- 60% of events are blocked (white).
- 30% are benign but allowed (also white, for situational awareness).
- 10% are gray — requiring investigation.
This 10% becomes the SOC’s efficiency focus. The mission is simple: shrink it relentlessly.
- Detection engineers tune rules, pull back overly noisy detections, and sharpen signatures for specificity.
- Threat analysts vet the external landscape and feed relevant intelligence back into detection design.
- Analysts adopt a “touch-once-and-triage” discipline. If a type of event is investigated once and has a clear outcome, it gets tuned or automated so no one has to touch it again.
- Automation engineers keep pace with shifting telemetry. Nothing is “set and forget.” Automations must evolve as event formats and analyst actions evolve.
Examples of Gray Events (Could Be Good or Bad)
1. Unusual PowerShell Execution
Scenario: An endpoint runs PowerShell with suspicious flags; may be admin maintenance or LoTL.
SOC explanation:
- If a user normally runs 3 suspicious PowerShell commands per week and suddenly runs 20, that’s a big jump.
- The math says: “This spike is so unusual, there’s only about a 1% chance it happened by accident.”
- In practice, that means: don’t ignore it — investigate or automate a block.
Statistical test (Poisson rate ratio, user vs. peer group):
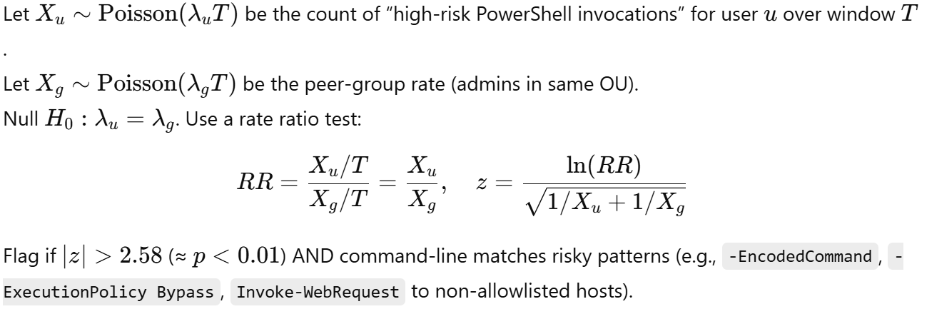
In this example:
- Z-score of 2.58 → In statistics, this means the event is 2.58 standard deviations away from the statistical normal (norm).
- p-value of 0.01 → This means there’s only a 1% chance that what you’re seeing is just random noise.
Automation steps:
- If user ∉ admin group: SOAR → EDR kill process + block hash if present.
- Collect triage: grab ScriptBlock logs, full cmdline, parent/child process tree, network connections.
- EDR isolate host if concurrent network beacons detected.
- Open ticket with artifacts; attach the z-test values and RR.
- Tune detection: if benign (e.g., approved admin script), add hash/path/issuer allowlist; else promote to black with auto-response.
2. Outbound DNS Query to a Rare Domain
Scenario: A host queries a domain never (or almost never) seen internally; could be new SaaS or DGA beaconing.
SOC explanation: When a host inside your network asks for a domain name you’ve basically never seen before.
- Sometimes it’s innocent: a user tries a new SaaS app, or IT spins up a new cloud tool.
- Sometimes it’s trouble: malware using an algorithm (DGA – domain generation algorithm) to create random-looking domains for command-and-control.
Statistical test (Bayesian update on rarity + DGA score):
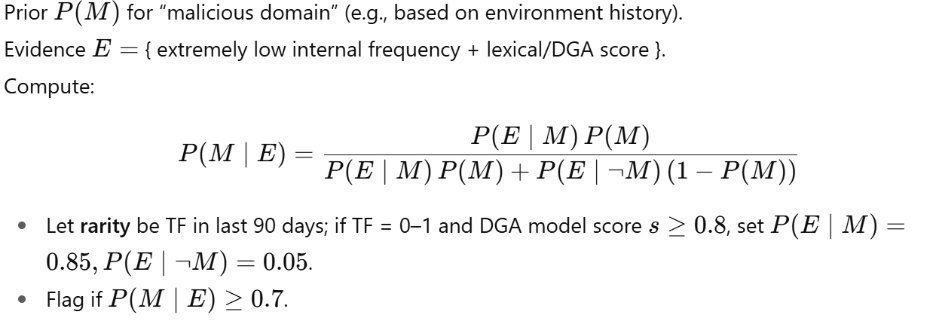
In this example:
- TF in the last 90 days = 0–1
Translation: In three months of logs across your whole environment, you’ve seen this domain zero or one times. That makes it “rare.” - DGA model score > 0.8
Translation: The machine-learning model that scores domains for randomness is saying “this looks 80%+ like a machine-generated domain.” That makes it “suspicious.” - P(E|M) = 0.85
Translation: If the domain really is malicious, there’s an 85% chance it would look like this (rare + high DGA score). Evidence is consistent with bad. - P(E|¬M) = 0.05
Translation: If the domain is actually benign, only 5% of the time would it look this weird. Very few normal domains behave this way.
Automation steps:
- Sinkhole the domain (DNS policy) for 60 minutes (containment window).
- Auto-enrich: pull WHOIS age, passive DNS, threat-intel hits, TLS cert age/mismatch.
- Detonate via sandbox: HTTP GET/POST from a controlled runner.
- If additional hits: block egress to FQDN + netrange in NGFW; push host IOC block to EDR.
- Case note with the Bayes posterior and features; if benign SaaS, add to allowlist + document owner/team.
3. Login From a New Country (Impossible Travel + Bayesian user profile)
Most security tools do this natively, but let’s pretend they didn’t for a moment.
Scenario: Authentication for same user from two distant geographies in short time; could be travel; could be a user toggling of VPN to cell tower; or account takeover.
SOC Explanation: You see a user log in from two distant countries within a short time window.
- Example: at 1:00 AM they authenticate from New York, and by 2:30 AM they authenticate from London.
- Physically, that’s impossible — unless they have a teleportation machine, it suggests their credentials are compromised.
Deterministic screen (impossible travel):

Statistical test (user-level Bayesian travel model):
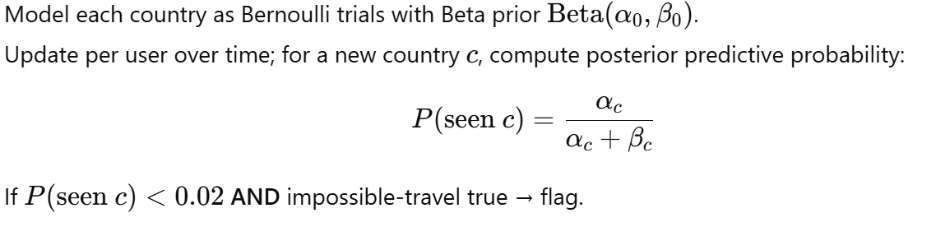
In this example:
- v > 900 km/h
- We calculate the great-circle distance between the two login locations.
- Then divide by the time difference to estimate the “travel speed.”
- If the speed would have to exceed 900 km/h (roughly the cruising speed of a commercial jet), it’s considered physically impossible.
- Plain English: “No human could have realistically moved that fast, so this login pair is highly suspicious.”
- P(seen country) < 0.02
- We model each user’s login history by country.
- If a user has logged in 1000 times, and never once from Brazil, the probability they should suddenly show up from Brazil is essentially zero.
- The model expresses this as < 0.02 (less than a 2% chance this country is part of the user’s normal behavior).
- Plain English: “This country is outside this person’s known pattern — it’s almost certainly unusual.”
Automation steps:
- IdP step-up MFA immediately; if fail → revoke refresh tokens + terminate sessions.
- Force password reset + invalidate app passwords.
- Conditional Access: block new geographies for 24h except after successful MFA.
- Pull audit: recent OAuth grants, inbox rules, token mint events, device registrations.
- If confirmed compromise → quarantine mailbox/endpoints, create IR case, notify user’s manager; else whitelist trip (start/end dates) in user profile.
Most common security analytics platforms have this ability to natively track geographically improbable access. This is a tricky one with mobile workers pinging off cell towers when accessing corporate devices. Advances in MFA technology have made this easier for security teams to create “challenge” scenarios to validate good or bad types of access.
4. Unusual File Transfer to Cloud Storage
Scenario: Large data upload to personal cloud; could be legitimate backup or exfil. Most users upload small files occasionally, but large or unusual uploads can signal data exfiltration.
Statistical test (robust outlier via median/MAD “modified z-score”):
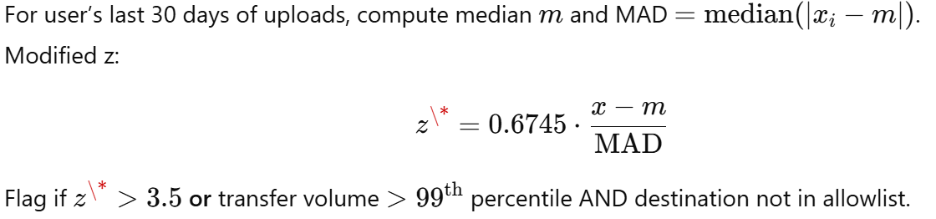
The trick is to compare today’s upload size/volume against the user’s own history:
- If the transfer is way larger than normal,
- Or in the top 1% of transfers ever seen, it’s a red flag.
In this example:
- 0.6745 = A scaling constant used in a modified z-score calculation. It converts median absolute deviation (MAD) into a standard deviation equivalent.
- Plain English: It’s just the math way to normalize differences from the median.
- 3.5 = The threshold for “extreme outlier.”
- Plain English: If the upload is more than ~3.5 times outside the normal variation, it’s statistically abnormal.
- Greater than 99% (99th percentile) If the transfer is bigger than almost every other upload in the dataset.
- Plain English: “This file is larger than what 99% of people normally upload — that’s not normal.”
Automation steps:
- CASB quarantine the object (retain, restrict sharing).
- Revoke the app’s OAuth token if app is unsanctioned.
- Scan content with DLP profiles (PII/PHI/code/IP).
- Alert data owner + manager with sample filenames and size; require justification link.
- If unjustified, block domain/app for user/org; add EGRESS policy to throttle large uploads pending approval.
5. Service Account Performing Interactive Login
Scenario: Service accounts should only run in the background (scheduled tasks, services, automation). They should never log in interactively (e.g., RDP or console login).A service account logs in interactively; could be misconfiguration or lateral movement.
Statistical test (Poisson rare-event with λ≈0):
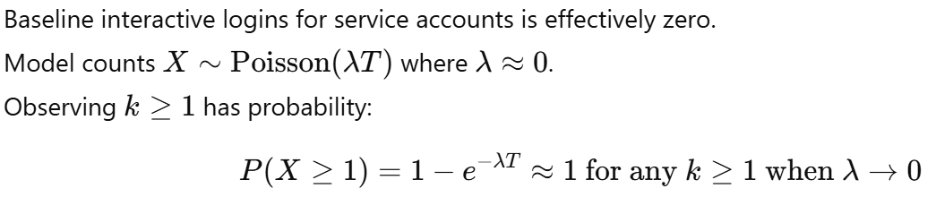
Treat any occurrence as statistically anomalous.
In this example:
- Model count 0, In your baseline data, the expected count of interactive logins for service accounts is zero.
- Plain English: “This should never happen.”
- k ≥ 1, Observing at least one event is enough to trigger an alert.
- Plain English: “Even one interactive login by a service account is abnormal and should be treated as suspicious.”
Automation steps:
- Disable interactive logon rights for service account OU via GPO/IdP policy (preventive).
- On detection: immediately disable account, rotate secrets (Key Vault), and kill sessions.
- Hunt: enumerate processes started by the account, endpoints touched, Kerberos ticket usage, and lateral movement edges.
- Re-provision the service account with least-privilege and non-interactive flag.
- Ship a control: SIEM rule to break-glass page if any future interactive attempt is seen.
Why This Matters
By operationalizing the binary decisioning model this way, you force the organization to:
- Treat black events as unambiguous crime scenes.
- Let white events remain white — don’t waste cycles second-guessing the tools.
- Attack the gray relentlessly, with tuning, automation, and statistical rigor.
Over time, the gray shrinks. And as it shrinks, you get closer to the real goal: a SOC where people do higher-order analysis, not play endless whack-a-mole with alerts.
The Tools Behind the Binary Decisioning Model: Splunk vs. Microsoft vs. Google SecOps
Turning analytics into outcomes:
Every modern SOC leader is drowning in telemetry; millions of daily events, thousands of alerts, and too few analysts to chase them all. Whether you’re running Splunk, Microsoft Sentinel, or Google SecOps (Chronicle), the fundamental challenge is the same: how do you separate the noise from the story?
The Binary Decisioning Model is designed for exactly that — taking lessons from fraud analytics and applying them to cybersecurity analytics. It replaces endless investigation loops with measurable outcomes.
The executive takeaway:
You don’t need to reinvent your technology stack. The platforms you already have: Splunk, Microsoft, or Google are capable of implementing binary decisioning today if you use them differently. Each can ingest data, apply statistical models, and automate responses. The difference is maturity, ecosystem, and how much tuning you’re willing to do.
When it’s working well, it’s quiet. That’s the paradox: a properly tuned binary decisioning model reduces alerts, burnout, and cost — and as a result, the SOC simply gets boring. That’s success. The ROI isn’t in volume; it’s in confidence, consistency, and calm.
The technical takeaway:
Splunk
Splunk is still the analytics powerhouse for raw data flexibility. Its Search Processing Language (SPL) and Machine Learning Toolkit can express every one of the models above:
- Poisson and Bayesian tests via stats, eventstats, or fit in MLTK.
- Modified z-scores via outlier command or calculated fields.
- Time-series anomaly detection via anomalydetection or predict.
Splunk’s advantage is transparency — you can see and tune the math. Its weakness is cost and complexity: you need people who understand both SOC operations and data science.
Microsoft Sentinel
Sentinel (and its Azure ML integrations) provides pre-built anomaly functions and native cloud automations:
- Impossible travel and rare country logins are built into Entra ID’s risk detections.
- Anomaly detection functions (series_decompose_anomalies(), percentiles(), etc.) replicate z-scores and outlier logic.
- Logic Apps provide automation hooks for containment and orchestration.
For enterprises already invested in Microsoft 365 E5 or Defender, Sentinel delivers rapid time-to-value with native enrichment (user identity, device health, DLP). It’s ideal for organizations that want results fast and are comfortable with managed AI rather than custom math.
Google SecOps (Chronicle)
Google’s platform, formerly Chronicle, takes a cloud-scale statistical approach by default. It was built for pattern detection over petabyte-scale telemetry, using BigQuery and Chronicle’s UAX (Universal Alerting Expressions).
- Rare domain detection and statistical baselines are native. Google’s models continuously learn from historical data.
- Outlier and clustering functions in BigQuery ML replicate Bayesian and Poisson tests at scale.
- Integration with VirusTotal and Google Cloud Security Command Center means enrichment is automatic. Google’s edge is scale and simplicity, you don’t tune math; you trust the platform to learn. Its trade-off is less granular transparency than Splunk, but easier sustainability than a fully custom stack.
The Invisible Model and the ROI of Silence
There’s a strange paradox in cybersecurity: the better your program gets, the less anyone notices it. Fraud teams learned this long ago. No one congratulates the payment fraud team at Apple for catching another fake card, they’re judged by how frictionless the customer experience feels. In cybersecurity, the same holds true: the goal isn’t noise, it’s confidence.
When the binary decisioning model is working, it’s quiet. Analysts aren’t drowning in gray noise; they’re tuning detections and optimizing automation. Executives aren’t reacting to incidents; they’re steering strategy with data that shows measurable improvement.
That’s the ROI of silence — fewer alerts, faster decisions, and a program that quietly, efficiently, does exactly what it’s supposed to.
Next Steps
For help turning these ideas into measurable outcomes at your organization, reach out to the NuHarbor team.
Don't miss another article. Subscribe to our blog now.
Included Topics